SuperRare’s price experienced a sharp reversal due to profit-taking after the token’s parabolic rise of over 500% between August 5 and August 15.
The SuperRare (RARE) token retreated to $0.2280, down by over 34% from its highest point on Sunday, Aug. 18. This downturn was primarily driven by profit-taking, as the recent surge lacked a substantial catalyst. Additionally, the token dropped after on-chain data revealed that the SuperRare Treasury transferred 7.5 million tokens to Binance. Typically, moving tokens to an exchange signals an intention to sell.
Fundamentally, SuperRare and other Non-Fungible Token (NFT) platforms like OpenSea and Rarible are struggling as trading volumes continue to decline.
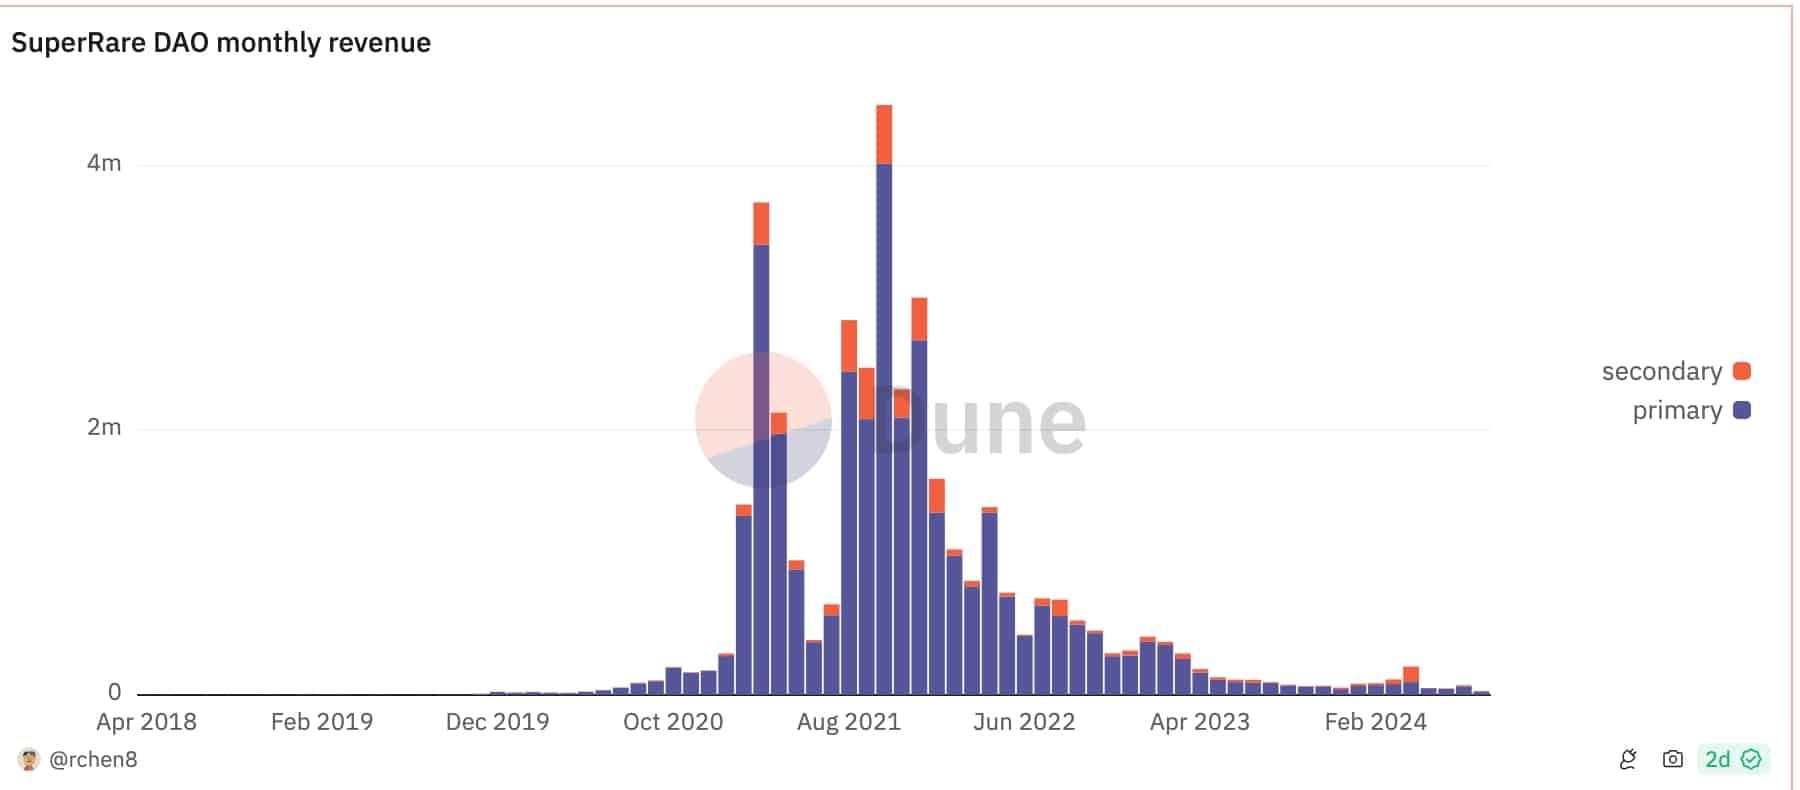
Data from Dune Analytics indicates that SuperRare’s monthly volume has plummeted to a record low. After reaching over $36 million in August 2021, the volume fell to under $1 million in July. This declining trend over the past two years led the company to reduce its workforce in 2023.

Similarly, OpenSea’s monthly volume dropped to $32 million in July from $643 million in Feb. 2023.
Additional data from CryptoSlam shows that global NFT sales volume has decreased by 37% in the last 30 days, totaling $387 million. At its peak, the industry was handling billions of dollars weekly, driven by popular collections like Bored Ape Yacht Club, Azuki, Art Blocks, and CryptoPunks.
SuperRare’s price surge also pushed its futures open interest to a record high of $112 million. Notably, the token had no open interest in the futures market for several days this month.
SuperRare price analysis

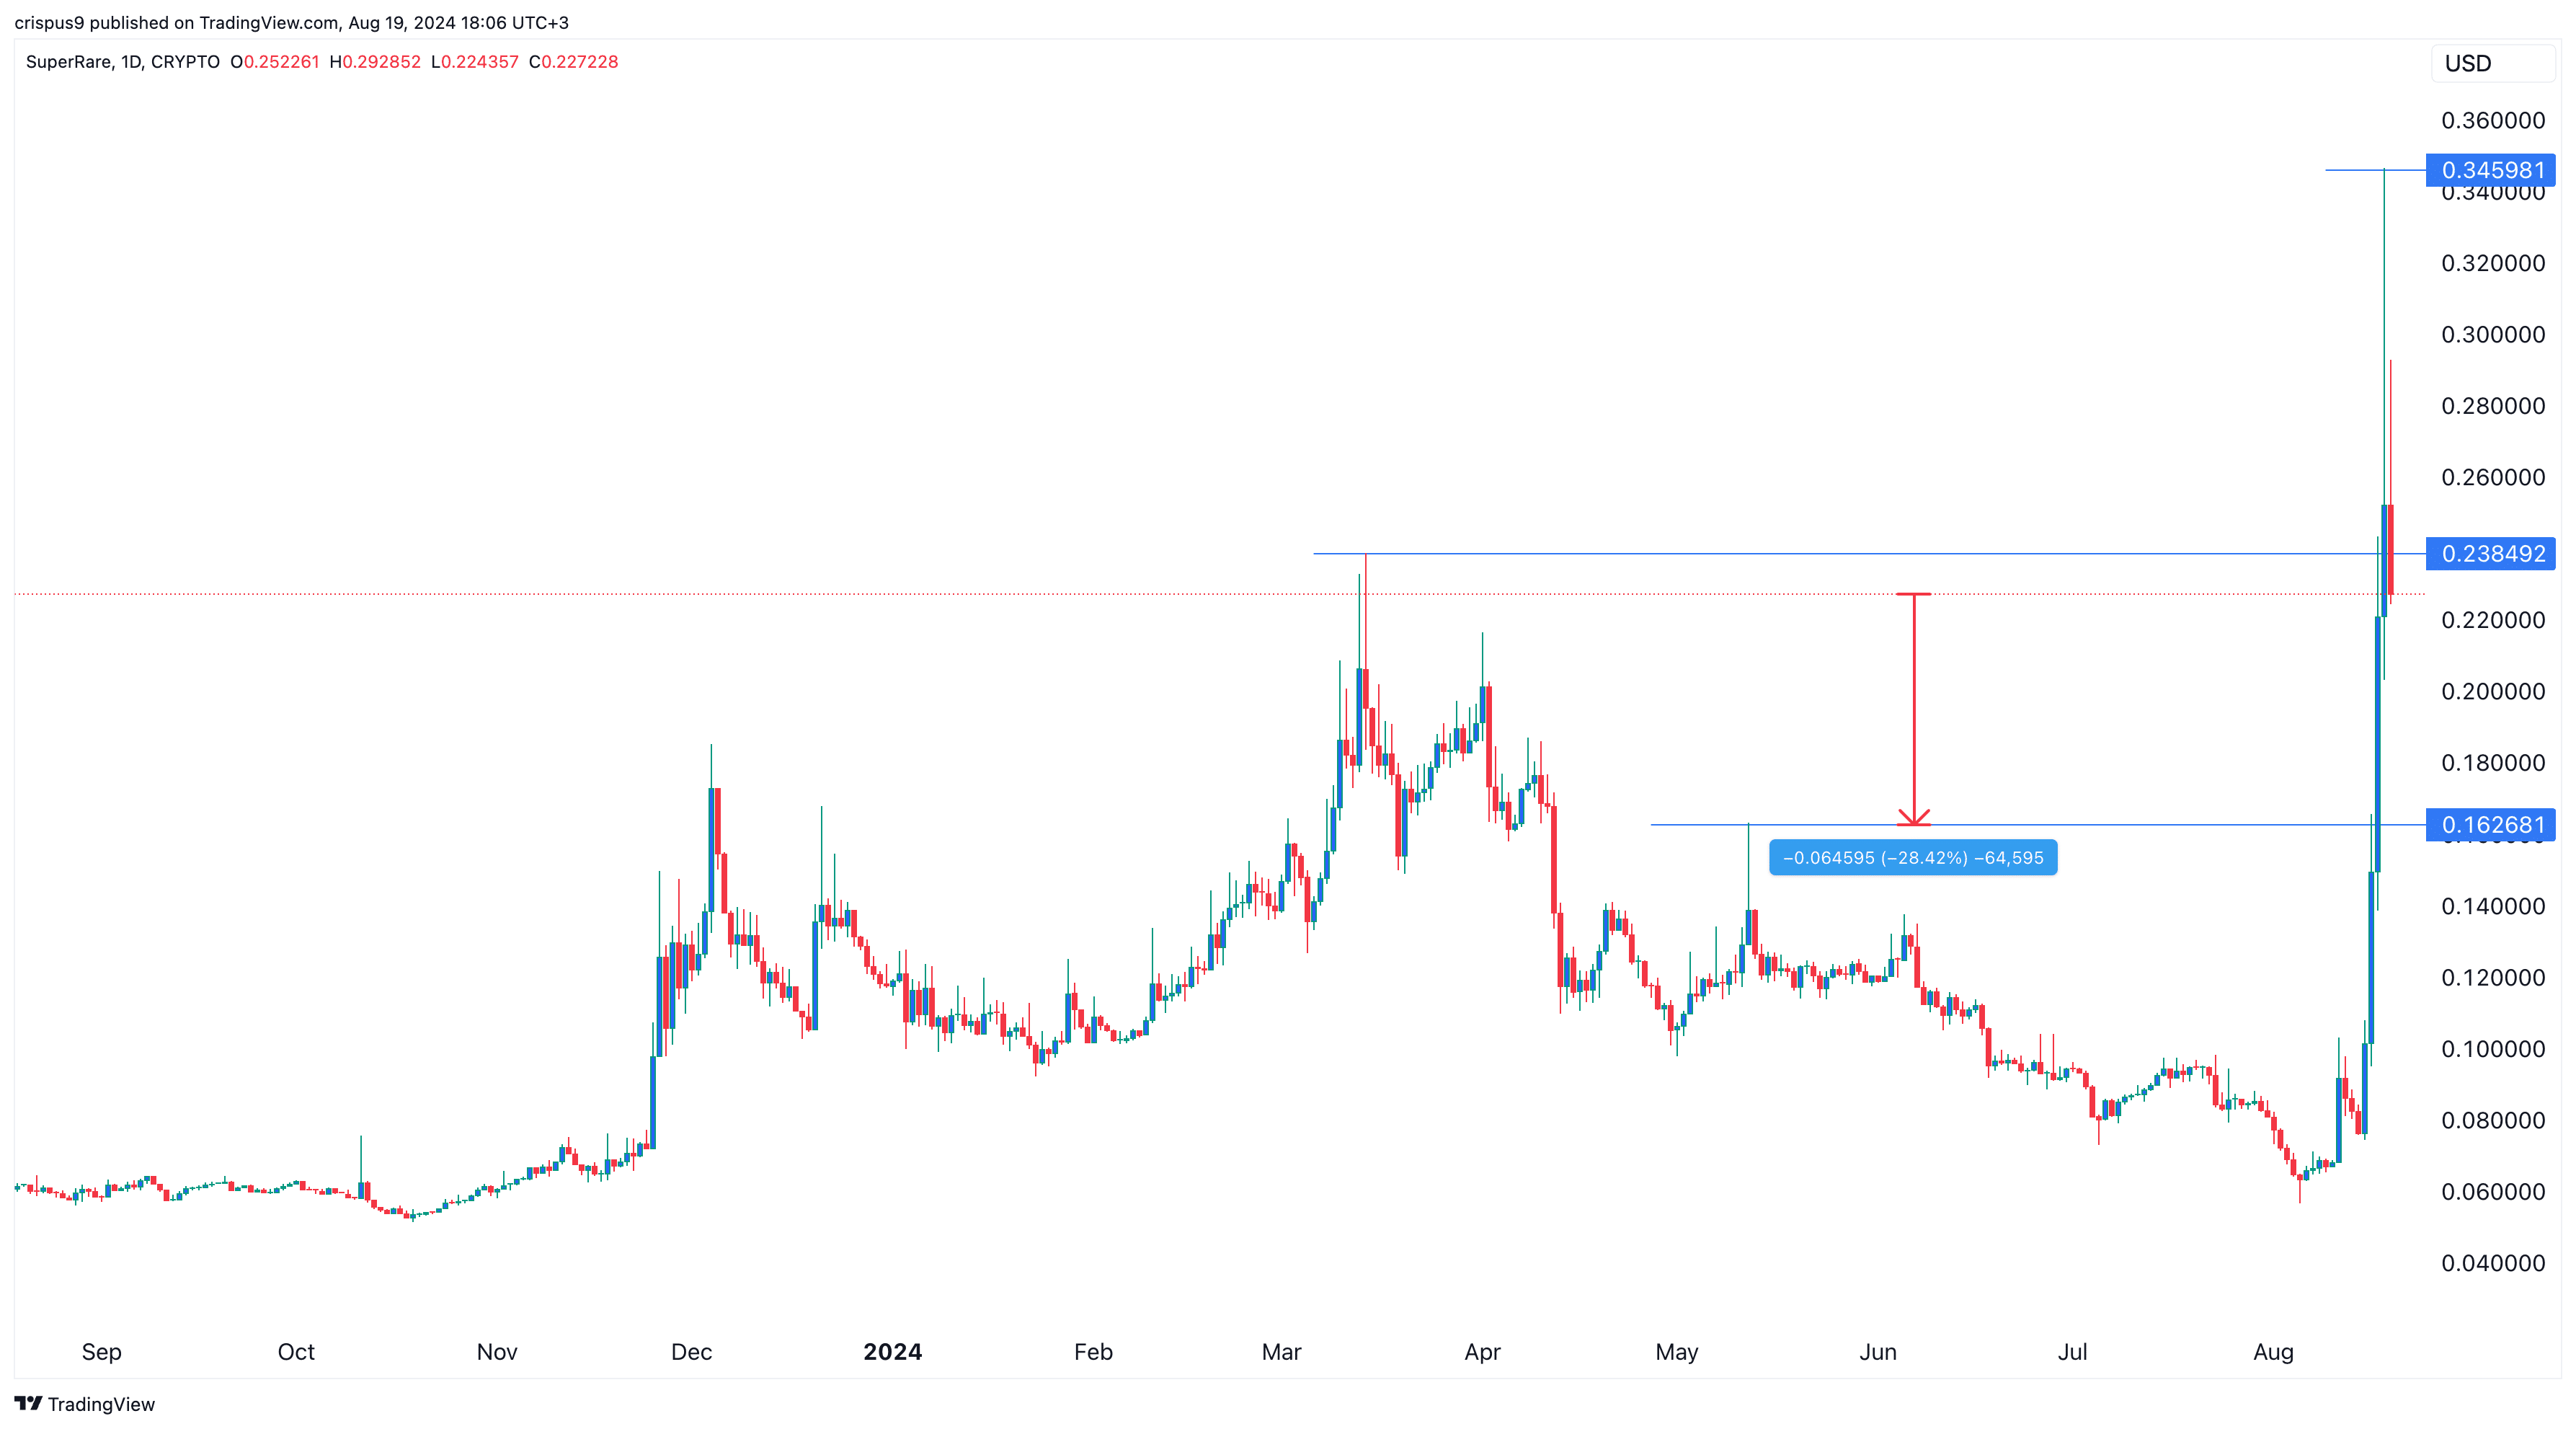
The daily chart shows that the RARE price went parabolic, trending on social media platforms like X and StockTwits. It peaked at $0.3460, the highest level since May 2022.
As it surged, the token broke through the key resistance point at $0.2384, which was its highest swing in March this year. It also moved above the 50-day moving average, while the Money Flow Index rose to the overbought level.
Given these factors, the token’s outlook appears bearish as many traders may begin to exit their positions. If this trend continues, the price could drop to the key support level at $0.1626, which was its highest swing on May 12 and 30% below its August 19 low.

