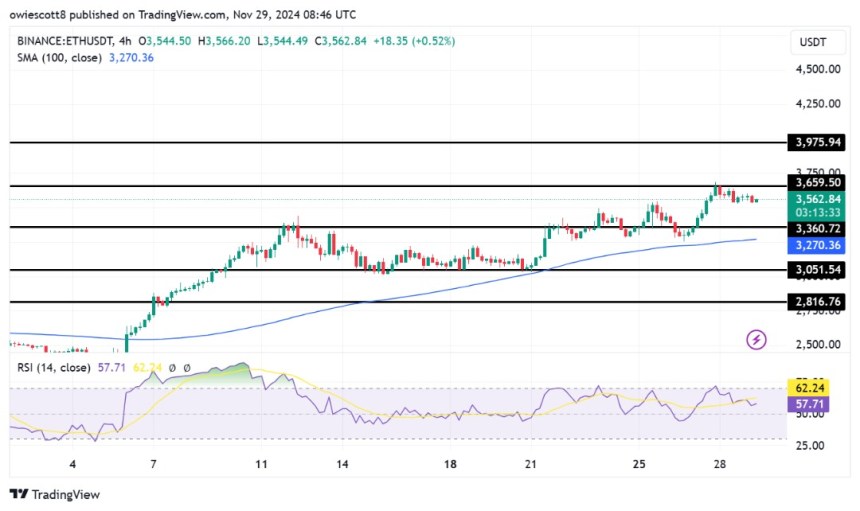
Ethereum is grappling with a critical resistance level at $3,659 as momentum appears to wane. After a period of steady gains, the cryptocurrency has moved into a consolidation phase, with bulls struggling to push it higher. The pause has raised questions about whether Ethereum’s rally is losing steam or simply gearing up for its next big move.
This article aims to analyze ETH’s current consolidation below the $3,659 resistance level, focusing on its implications for market pressure. It will also determine whether ETH can regain its upsurge or if fading strength could lead to further declines through technical indicators, support zones, and potential breakout scenarios.
What Key Indicators Say About Ethereum’s Price
ETH is displaying strong bearish momentum on the 4-hour chart, with its price attempting a move toward the $3,360 level and the crucial 100-day Simple Moving Average (SMA). This key level could act as dynamic support, determining the next move. A rebound may follow a successful defense, while a break below could lead to more drops and test lower support zones.

An analysis of the 4-hour chart shows that ETH’s Relative Strength Index (RSI) has dropped to 56%, down from the overbought zone. This decline signals a reduction in buying pressure, suggesting a possible shift in market sentiment. As the RSI pulls back, it indicates that bullish sentiment may be fading, and the market could be heading for consolidation or reversal. If the RSI continues to fall, it would confirm increasing selling pressure, potentially leading to deeper corrections.
Related Reading
Despite staying above the daily 100-day SMA, Ethereum is showing bearish signs, with its price steadily declining toward the $3,360 level. While the 100-day SMA offers some support, the downward movement implies that selling pressure is dominant, weakening the bullish momentum. A continued decline could test the strength of the $3,360 support, and a break below it might lead to further losses, signaling a deeper market pullback.

Finally, the 1-day RSI indicates growing negative pressure on ETH since the signal line fell back to 65%, aiming to move toward the 50% threshold. As the RSI continues to drop toward this threshold, it shows that sellers are gaining dominance, possibly paving the way for additional declines unless buying pressure can return to shift the sentiment.
Will Ethereum Find New Support Or Sink Further?
A key level to monitor is $3,360, which has historically served as a strong support zone. If Ethereum can hold above this level, it could trigger a rebound, pushing the price toward the next resistance at the $3,659 mark.
Related Reading
However, should the price fail to maintain above $3,360, ETH may experience a notable downswing, with $3,051 emerging as the next key support range. A break below this support may open the door to additional downward movement, targeting even lower support zones.
Featured image from Unsplash, chart from Tradingview.com

